Open a climate assessment report, an annual financial report or an engineering manual. The prose is often the least informative part. The warming projections sit in a figure, the revenue by segment in a table, and the wiring layout in a diagram. A text-only RAG pipeline extracts the paragraphs, silently drops everything else, and then answers "How much warming is projected under the high-emissions scenario?" with "The document does not specify". Meanwhile the answer is right there in a chart on page 12.
Multimodal RAG brings tables and images into the pipeline.
The naive fix, and why it isn't enough
The obvious idea is to have a vision model describe each image and each table in text, embed the description, and answer from the description. Search now works, because "warming projection chart for SSP5-8.5" can be found. But the answer suffers. A caption says "a line chart showing temperature rising under several scenarios", while the figure shows a best estimate of 4.4 °C of warming for 2081–2100 under SSP5-8.5, with a very likely range of 3.3–5.7 °C. Summaries throw away exactly the detail that made the figure worth reading.
The pattern: summarise for search, send the original for the answer
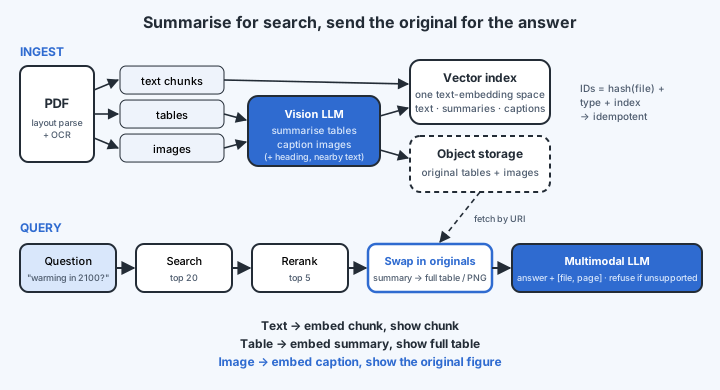
The robust design separates the two jobs:
| Element | What gets embedded (for search) | What the model sees (for answering) |
|---|---|---|
| Text | The chunk | The chunk |
| Table | A short LLM summary of the table | The full table (as Markdown) |
| Image | An LLM caption of the figure | The original image |
Summaries exist only so that search can find the element. Once found, the original replaces the summary in the prompt, and a vision-capable model reads the actual table and the actual figure. Because every summary and every caption is text, one text-embedding model covers all three types: one vector space, one index, one top-k.
Ingestion, step by step
- Parse the layout. A document parser (for example Docling, Unstructured or a cloud document-AI service) identifies headings, paragraphs, tables and figures, runs OCR on scanned pages, and recovers table structure, not just the raw text. Look at the parse output for a new document type before embedding anything, because parsing errors propagate through everything else.
- Chunk the text section-aware, measuring chunk size with the same tokenizer as the embedding model, so that chunks never exceed its input limit.
- Extract tables as Markdown or HTML, which preserves rows and columns for the model to read later.
- Extract images at a decent resolution, skipping tiny ones (logos, icons) and exact duplicates (repeated banners), detected by hashing.
- Describe them with context. A vision model captions each image and summarises each table. Give it the figure's own caption, its section heading and the nearest paragraph as well. Captioned with no context, you get "a line chart with several coloured lines". With context, you get the scenario names and the variable being plotted, which is what people actually search for.
- Store the originals in object storage (S3 or similar) at a predictable path such as
{doc_id}/page_{n}/{type}_{index}, and put only the short search text plus a pointer (URI) in the vector record. Vector databases cap metadata size per record (often tens of kilobytes), so images and large tables never go into metadata. - Embed and upsert all three types, with metadata for type, page, section and source file.
Keep re-ingestion idempotent, as in Module 6: derive the document ID from a hash of the file's bytes, and each record's ID from (document ID, element type, index). Ingesting the same PDF ten times then leaves the vector count unchanged.
Answering, step by step
- Retrieve the top 20 or so by vector similarity, across text, tables and images together (or filtered to one type, for example "only figures").
- Rerank to the top 5 (Module 4).
- Swap in the originals. For each table or image result, fetch the full Markdown table or the image from storage.
- Ask a vision-capable model in a single multimodal message: the question, the text chunks, the full tables and the images. Instruct it to cite [file, page] for every claim and to refuse when the evidence does not support an answer.
- Show sources, including links to the figures (for example, short-lived signed URLs), so users can see the chart for themselves.
Alternative designs
- Multimodal embeddings. Models that embed images and text into a shared space (CLIP-style) let you search images directly with a text query, with no captioning step. They are good at "find the photo of a red valve", and weaker on dense charts and text-heavy figures.
- Page-image retrieval. Treat every page as an image and embed it with a vision-language retriever (the ColPali family is the best-known example), skipping layout parsing entirely. This is strong for visually complex documents such as slides, forms and infographics, at a higher storage and compute cost.
- Tables to SQL. When documents carry large, regular tables, such as financial statements or spec sheets, load them into a database and answer numeric questions with text-to-SQL (Module 7) rather than asking a model to read 400 rows.