A user reports: "The bot told me I have 15 days of leave. It's 20." Your evaluation dashboard shows faithfulness at 0.91 and recall@5 at 0.88, which is fine on average and useless for this one case. To fix it you need to see exactly what happened on that request: what the question became after rewriting, which chunks came back and in what order, what the prompt looked like when it reached the model, and what the model said. That record is a trace.
What a trace is
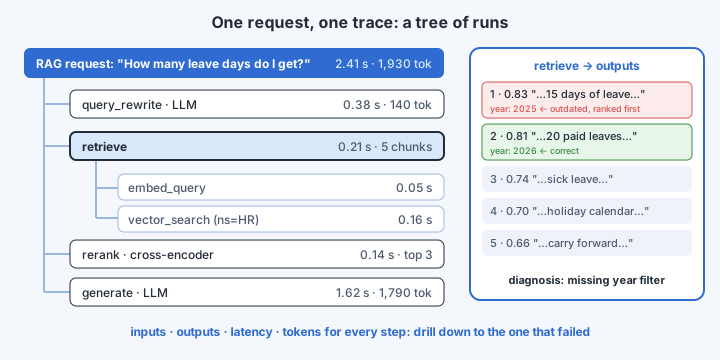
A trace is the structured history of one request through your system. It is a tree of runs (also called spans), one per step, each recording:
- its inputs and outputs (the query, the retrieved chunks, the exact prompt, the completion);
- timing: start, end, latency;
- cost signals: tokens in and out, and model name;
- metadata and tags: user or session ID, app version, route taken, retriever configuration;
- errors, if any.
Steps nest. An agent run contains a routing call, which contains an LLM call. A retrieval step contains an embedding call and a vector-store query. Because the trace is a tree, you can expand it from the top-level request down to the exact LLM call that went wrong.
The tools
LangSmith (from the LangChain team) records traces automatically for LangChain and LangGraph applications once tracing is switched on through an environment setting, so every node, retriever and model call appears without code changes. Your own functions (a custom retrieval helper, the top-level pipeline entry point) are added to the tree by marking them as traceable, optionally with tags such as a pipeline version ("v1", "v2-hybrid") and metadata that let you filter and compare runs later. Each run gets a run ID, which is how feedback is attached afterwards. Comparable tools include Langfuse, Arize Phoenix and others, many built on OpenTelemetry conventions, so traces can flow into the observability stack you already run. The concepts below apply to all of them.
Debugging, one step at a time
Take the "15 days instead of 20" report and walk the trace in pipeline order. Each step either clears or convicts one component.
- The query. Was the question rewritten, and is the rewrite faithful to the original? A rewriting step that turned "annual leave" into "casual leave" has already doomed the request.
- Routing and filters. Did the request go to the right index or namespace, with the right metadata filter? A missing
year = 2026filter explains a 2025 answer immediately. - Retrieval. Is the correct chunk ("20 paid leaves annually") among the results? If not, the problem is upstream: chunking, embeddings, hybrid weights. If it is present, note its rank and score, and look for an outdated chunk ("15 days", from last year) ranked above it.
- Reranking. Did the reranker keep the right chunk in the final top-k, or drop it?
- The prompt. Read the exact prompt as sent. Was the right chunk included, or truncated away by a context limit? Are two conflicting chunks both present with nothing to say which is current?
- Generation. If the prompt contained the right chunk and the model still said 15, it is a faithfulness failure: fix the prompt or the model.
In this example the trace would most likely show both the 2025 and 2026 chunks retrieved, with the old one ranked first. The fix is not a new model. It is metadata versioning (Module 4) or removing stale chunks (Module 6). Without the trace you would have been guessing.
Beyond single requests
- Latency and cost breakdowns. Aggregating runs shows where time and money go. Often the slowest step is not the LLM but an unindexed filter, a large rerank batch or an oversized prompt.
- Feedback. Attach scored signals to a trace's run ID: a user's thumbs up or down, a reviewer's 0–1 "relevance" score with a comment, or an automatic judge's verdict. Then filter to the low-scored runs to find failure clusters.
- Comparing versions. Tag runs with the pipeline version and compare latency, cost and feedback between "v1" and "v2-hybrid" on real traffic, which complements the offline evaluation set.
- From traces to test cases. A failing production trace, once labelled, belongs in your golden dataset (previous chapter), so it is checked on every future change. Tracing tools usually let you add a trace to a dataset in one click.
- Online evaluation. Run lightweight judges (faithfulness, relevancy) on a sample of live traffic to watch quality over time, not only before releases.
Traces store questions, retrieved document text and answers, which may include personal or confidential information. Apply the same controls as for any production data store: redact or mask sensitive fields, set retention limits, restrict access, and keep the tracing backend in an approved region or self-host it.