The last chapter walked us into a wall, so let us look at it properly. For open-ended work — conversation, explanation, creative writing, reasoning — there is no reference answer to compare against. The set of good replies is unbounded, and two excellent answers to the same question may share almost no words at all. Overlap metrics are useless here, and perplexity was never looking at the output to begin with. So what is left? Only the oldest method there is: ask people which one they prefer.
What remains is human judgement. But asking people to score a response out of ten produces noise: raters disagree about what seven means, drift over a session, and cannot be compared with each other. Asking a much simpler question works far better — shown two responses to the same prompt, which do you prefer? Comparison is a far easier judgement than absolute scoring, which is the same reason preference data drives alignment, as the Model Alignment lesson described.
That leaves a problem of arithmetic. Thousands of pairwise votes, scattered across different model pairings, have to become one ordered leaderboard. The solution was already sitting in competitive chess.
Borrowing a rating system from chess
Elo rates players by a single number that moves after every game. A new player starts at some baseline; beating a strong opponent raises the number sharply, beating a weak one barely moves it, and losing works in reverse. After enough games the number reflects relative skill, and the gap between two players predicts who wins.
Mapping this onto models is direct. A player is a model. A game is one prompt, answered by two models, with a person choosing the better response. A win is being chosen; a draw is a judged tie.
The mechanics
Every model starts at a baseline. A common choice is 1000. Before any comparison, no model has demonstrated anything, so they are all equal.
Each match produces an expected score. Before updating anything, the system asks what should happen given current ratings. For model A against model B:
This is a logistic curve giving a value between 0 and 1 — the probability that A wins. Equal ratings give 0.5 each. A 100-point lead gives roughly 0.64; a 200-point lead roughly 0.76. The rating gap is the odds, which is what makes the scale readable: you can look at a leaderboard and know not just the order but by how much.
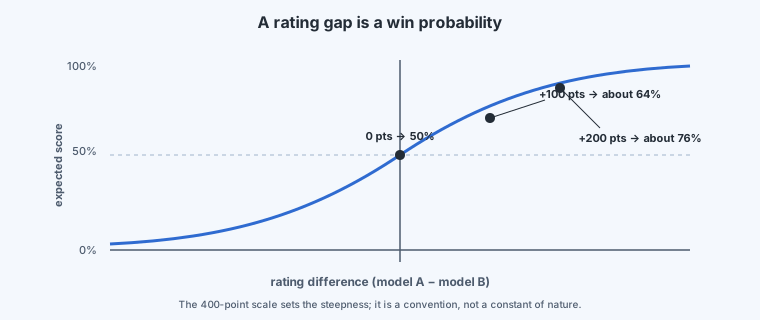
That constant only sets how steep the curve is — how much a rating point is worth in win probability. It was chosen for chess and carries no deeper meaning. Systems built for model evaluation sometimes use a different scale, or fit a Bradley–Terry model (the same logistic comparison written with base ) and tune the scale against the data. All of it is the same machinery; what changes is the exchange rate. If you alter the constant, every rule of thumb about point gaps has to be recalculated with it.
The result updates both ratings. With the actual outcome — 1 for a win, 0 for a loss, 0.5 for a tie — and the expected score:
Everything interesting is in the term : how surprising the result was. A heavy favourite that wins had near 1, so is nearly zero and it gains almost nothing. An underdog that wins had a small , so it gains a lot — and its opponent loses the same amount. Beating a strong model is worth more than beating a weak one, automatically, without anyone deciding so.
sets the step size. A large makes ratings responsive and jumpy; a small one makes them stable and slow to react. Values around 16 to 32 are typical.
Ties are handled by giving both sides , which nudges the higher-rated model down slightly and the lower-rated one up — a draw against a weaker opponent is mildly bad news.
Updates are continuous. Ratings adjust after each result, so the system is self-correcting: a model rated too high keeps meeting expectations it cannot satisfy and bleeds points until the number matches reality.
Why this fits model evaluation so well
It does not need every pairing. The common assumption is that ranking models requires all matchups. It does not, because information propagates through the comparison graph: if A reliably beats B and B reliably beats C, the system already holds evidence about A against C. Sampling matchups — especially between models with similar ratings, where the result is most informative — converges to a stable ranking with far fewer comparisons than exhaustive play. This is what makes the approach practical for dozens of models.
New models slot in cheaply. A model released today gets a provisional rating from a handful of targeted matches, with no need to redo anything that came before. For a field where models appear weekly, this matters more than it might sound.
It produces a single transitive order. Raw pairwise win rates can cycle — A beats B, B beats C, C beats A — leaving no coherent ranking. Elo resolves everything onto one axis, so every model has a position.
It needs no rubric. The only input is which response won. Raters never have to agree on what a score means, which removes the largest source of noise in human evaluation.
It is interpretable. A rating gap converts straight into a win probability, so the leaderboard answers "how much better?" and not only "which is better?"
This is the design behind public model arenas, where visitors are shown two anonymous responses to their own prompt, vote for one, and are told afterwards which models they were comparing. The votes feed Elo updates and the leaderboard moves continuously.
What makes it hard to run well
The arithmetic is the easy part. The difficulties are in the evaluation design, and ignoring them produces a leaderboard that measures the wrong thing.
Raters are biased and inconsistent. People favour longer answers, confident phrasing, and formatting that looks thorough, somewhat independently of whether the content is better. Individual judgement also varies with attention and expertise. The defences are structural: multiple independent judgements per comparison, aggregated; statistical detection of raters whose votes disagree with consensus so they can be down-weighted; and calibration items with known answers mixed into the stream.
Presentation biases the vote. People tend to favour whichever response is shown first. Randomising the order on every comparison and keeping model identities hidden removes both position bias and brand preference — otherwise you are partly measuring reputation.
New models are unreliable at first. A model with few matches has a rating that is mostly noise, and it can appear high or low on the board for no good reason. Seeding against a set of reference models of known strength, or starting it at a conservative rating and marking it provisional until it has enough games, both work.
Comparisons cost money and time. Every data point is a person reading two responses. Keeping it affordable means sampling matchups rather than running a round robin, generating and caching model outputs in advance so raters are never waiting, and concentrating comparisons where they are most informative — between models whose ratings are close.
The obvious reaction to rater bias is to go back to automatic metrics. But for open-ended generation, the automatic metrics do not measure the thing in question: BLEU and ROUGE cannot tell whether an explanation is clear or an argument sound, and perplexity is not looking at the output at all. Human preference, imperfect as it is, is the only signal that tracks quality here. The response to its flaws is to engineer around them — multiple raters, randomised order, anonymity, down-weighting unreliable voters — not to substitute a precise measurement of something else.
Where the three metrics leave us
Each of this module's metrics answers a different question, and each is blind where another sees.
| Measures | Needs | Blind to | |
|---|---|---|---|
| Perplexity | Probability assigned to real text | A held-out corpus | Output quality, coherence, truth |
| BLEU / ROUGE | Overlap with a reference | Reference text | Paraphrase, meaning, correctness |
| Elo | Which output people prefer | Human comparisons | Absolute quality; inherits rater biases |
In practice a serious evaluation uses all three, plus task-specific checks: perplexity to watch training, overlap metrics where references genuinely exist, and preference-based ranking for everything open-ended. No single number tells you whether a model is good — and a team that reports only the one its model happens to win on is telling you very little.